microworks - Fotolia
How to use VMware Horizon Performance Tracker
A good user experience is essential for VDI. Learn how to install and use VMware Horizon Performance Tracker to take the pulse of end-user experience.

A successful VDI deployment must have good UX, and VMware administrators can take the pulse of their end users' experience with the built-in VMware Horizon Performance Tracker.
There are, of course, plenty of third-party services and add-ons that IT administrators could turn to for virtual desktop monitoring. However, VMware Horizon Performance Tracker offers a level of simplicity from an integration perspective.
This native tracker can provide plenty of value for IT admins, but they must know how to use it.
Challenges of UX monitoring for VDI
It's often a challenge for IT to measure UX because it takes into consideration a variety of factors. IT must understand how an end user consumes a remote application or desktop. For example, does an application appear immediately after the user starts it? How long does it take before the virtual machine establishes a session with a desktop that a user can access? Is it cumbersome when a user tries to access a certain file? The better these processes behave, the better the UX.
When VMware released the first version of the product that is now VMware Horizon, systems administrators managed most VDI platforms. They also managed other VMware infrastructure, such as servers. Many admins monitored VDI platforms with their existing monitoring systems, such as Nagios or vRealize Operations.
From an administrative standpoint, this makes perfect sense. This approach fails to monitor performance effectively, however, because these tools present data with a certain lag. If CPU usage on a virtual desktop starts to spike, the tool will show the data within a couple of minutes, and alerts start to appear. For server infrastructure, this is perfectly fine. For UX monitoring, however, this is far too late.
UX monitoring differs from server and availability monitoring; for UX monitoring, the data needs to be as real-time as possible -- preferably just a couple of seconds old. It's difficult for IT teams to troubleshoot an end-user performance issue with older data. IT must have real-time information, such as frame rate, latency, bandwidth consumption and CPU/RAM resources to help a user.
How to use VMware Horizon Performance Tracker
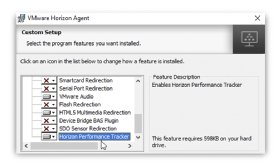
To address the nuances of UX monitoring, VMware introduced Horizon Performance Tracker in VMware Horizon 7.5, which comes free with all editions of VMware Horizon. Admins can easily install it as one of the options in the Horizon Agent setup (Figure 1).
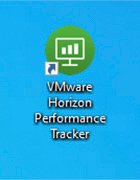 Figure 2. VMware Horizon
Performance Tracker icon
After the IT administrator finishes the installation process and the user can access the virtual desktop, an icon will appear on the user's desktop (Figure 2). This icon confirms for the end user that the tracker is present and functioning on the underlying OS. IT administrators should communicate that the tracker is an internal operation that focuses on UX instead of anything more nefarious.
When IT accesses VMware Horizon Performance Tracker, there are two main tabs: At a Glance and Session Properties.
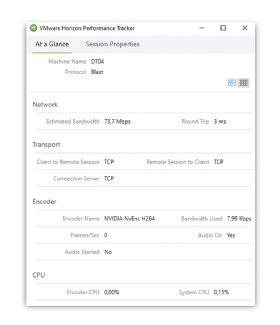
The At a Glance tab will show metrics associated with the remote connection to the virtual desktop or remote app -- or remote desktop in the case of Remote Desktop Session Host or Windows Virtual Desktop (Figure 3). This will include network bandwidth, the given protocol, data about the encoder, transporter and more.
The most important metrics, such as bandwidth usage, frames per second and CPU usage, are all located in this main tab and show the latest value. IT can change from a grid to a graph view (Figure 4). With the graph view, IT administrators can review information on bandwidth, resource usage and frames per second.
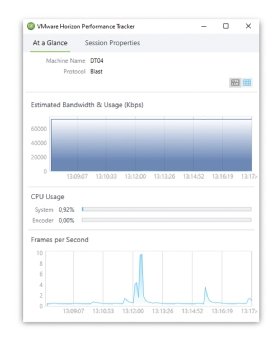
IT should look at the last 20 minutes of the most important metrics to troubleshoot UX-related issues.
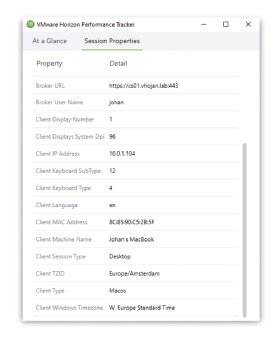
Finally, the Session Properties tab shows the session details to help IT determine the location, device and peripheral details, such as keyboard settings (Figure 5). This information can reveal whether the end user's endpoints -- including components such as display -- have any issues on their own.
Shortcomings of VMware Horizon Performance Tracker
VMware Horizon Performance Tracker is a useful tool, but there are a few shortcomings.
It doesn't show which channels the connection protocol uses and how much bandwidth they consume. It doesn't track GPU details, such as framebuffer usage, GPU usage and GPU profile type. VMware Horizon Performance Tracker doesn't include detailed resource consumption, such as CPU usage, including clock speed, RAM usage and disk I/O. The free Horizon Helpdesk fling includes most of these metrics but lacks enterprise support.
VMware Horizon Performance Tracker also lacks the ability to tweak and tune the connection protocol for a single session. Remote Display Analyzer, however, can push the UX buttons and adjust the connection protocols for different end-user situations.